Aerodrome & Airspace Engineering

Airfield Planning & Analytical Frameworks

Universal Aerospace Solutions executes comprehensive aeronautical diagnostics and layout optimizations in strict compliance with ICAO Annex 14 (Volume I Aerodromes) and FAA Part 157 / Part 77 parameters. Our capabilities bridge core civil aviation criteria with high-fidelity structural data.
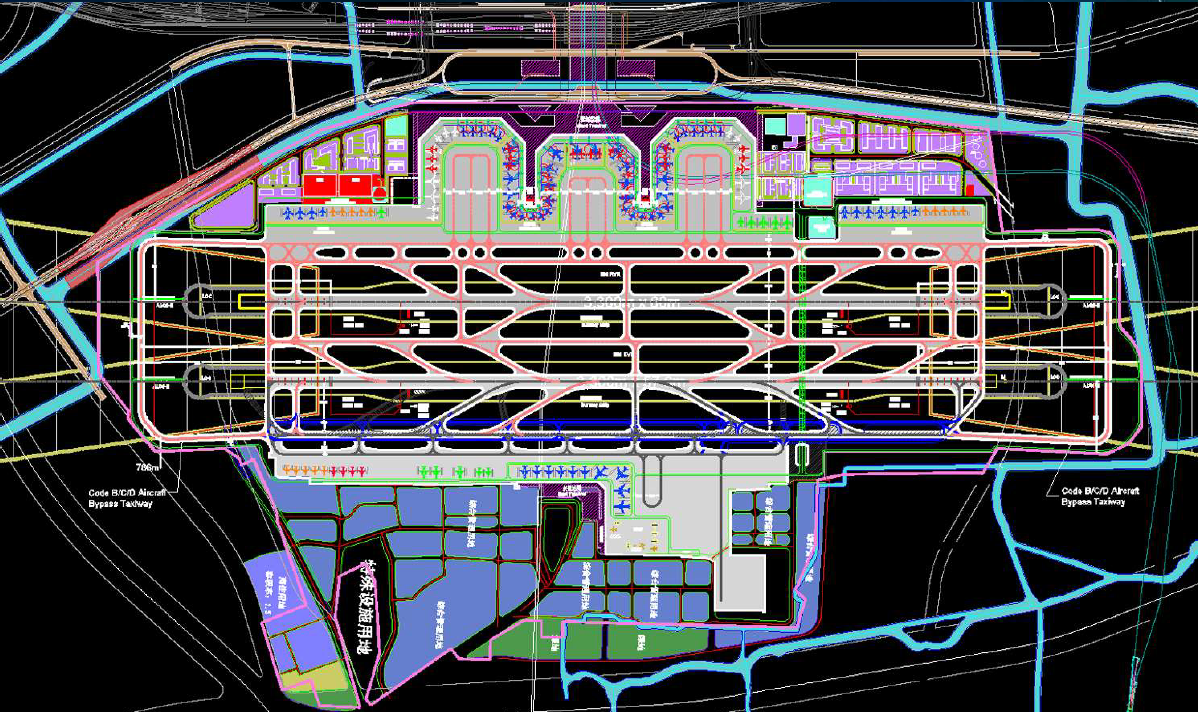
Master Plan 1
Master Plan 2
Master Plan 3

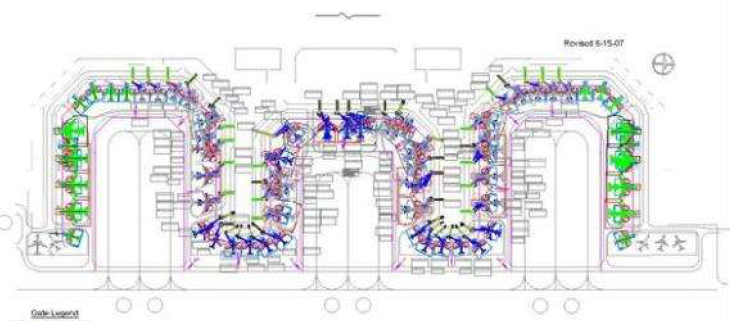
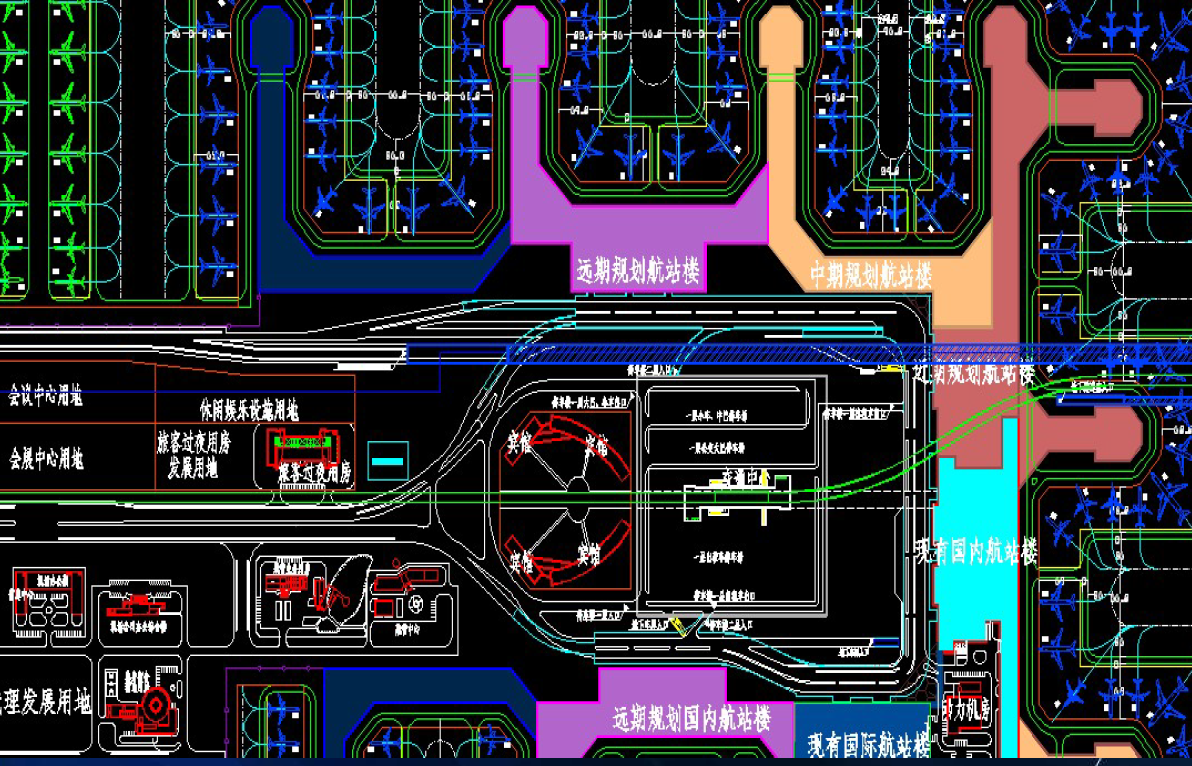
Airport Master Planning

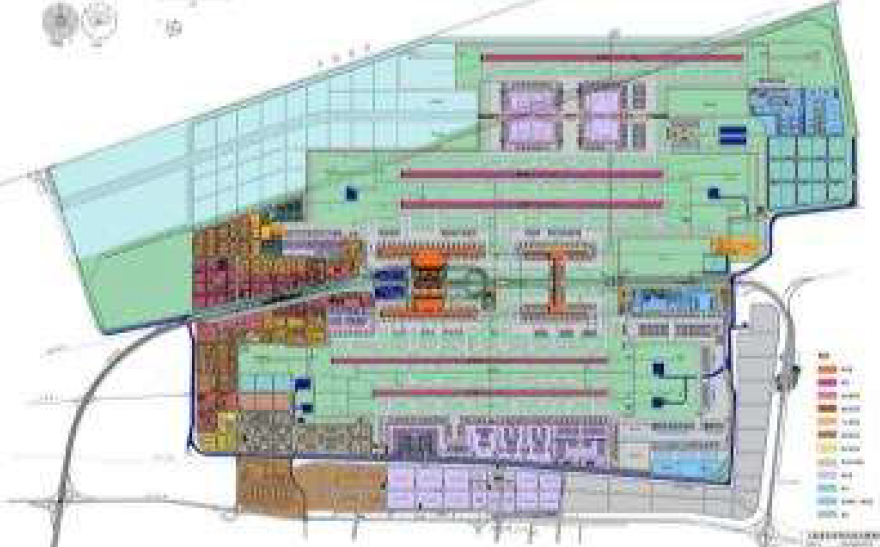
Development of core frameworks including comprehensive Airfield Master Plans, ALP Updates, Terminal Planning and Design, Aviation Demand Forecasting, Capacity/Delay Analyses, and detailed Facility Requirement Scale Planning.

Capacity 1
Capacity 2
Capacity 3

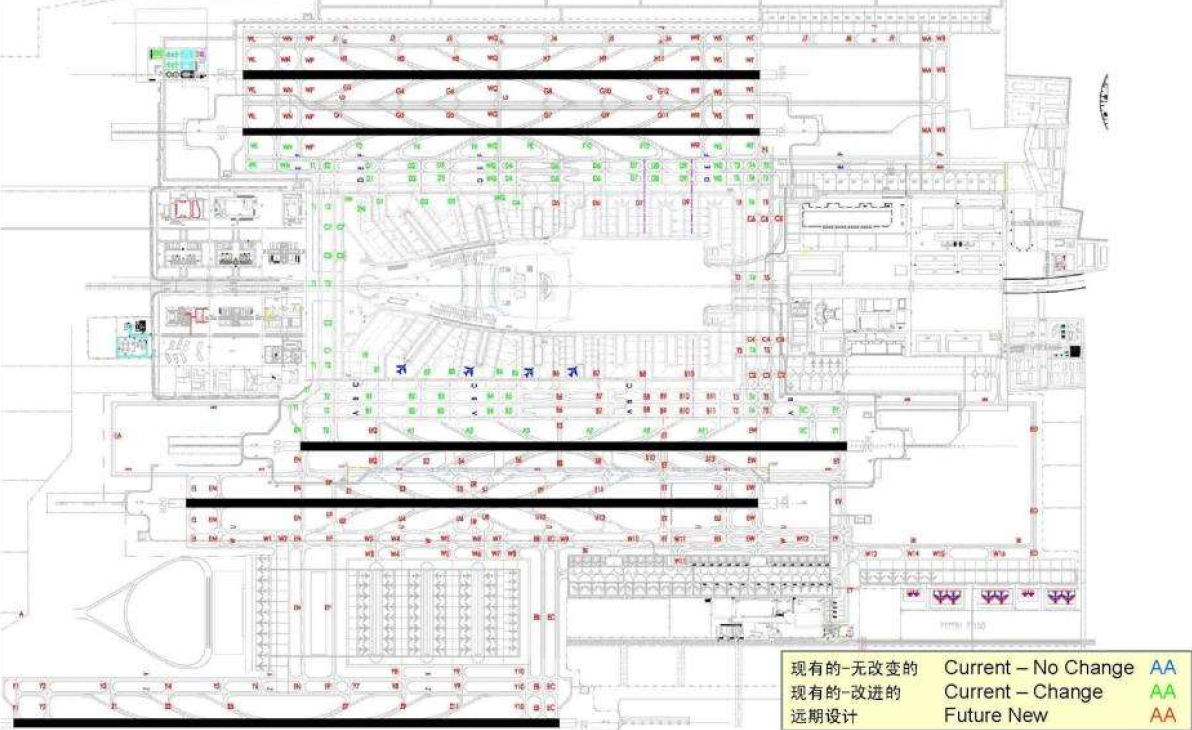
Airfield Capacity Analytics

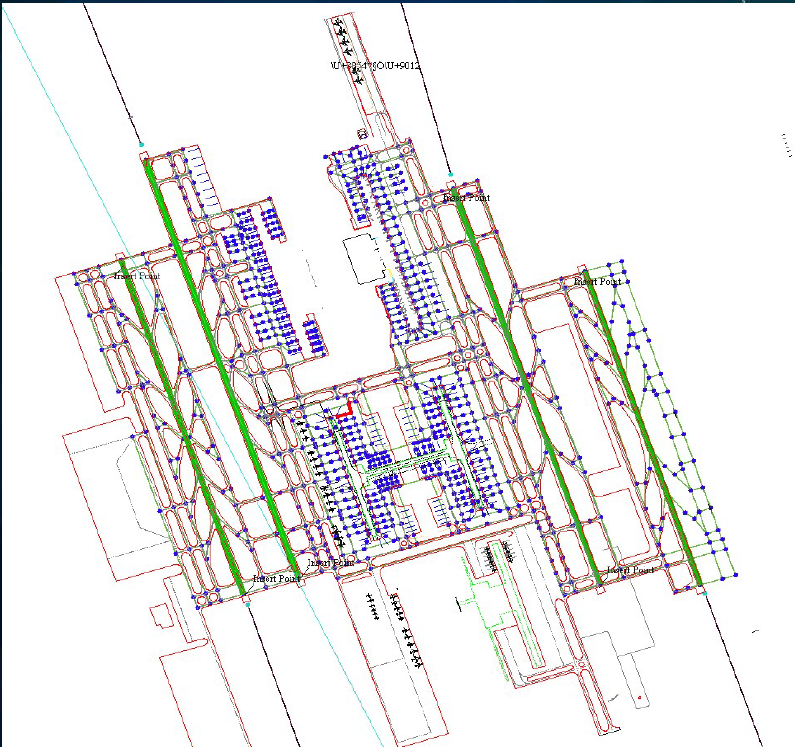
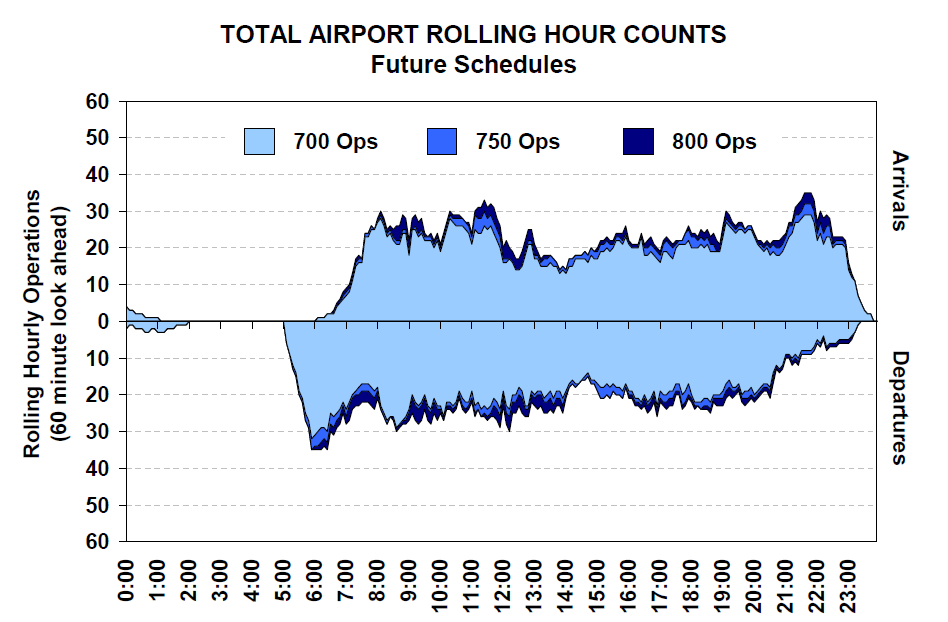
Advanced data diagnostics spanning Facility Utilization, Delay Reduction Measures, Dynamic Queuing Models, Runway Evaluation Performance (REDIM), and multi-source data mining across PASSUR, TARGETS, and ANOMS platforms.

Terminal 1
Terminal 2
Terminal 3

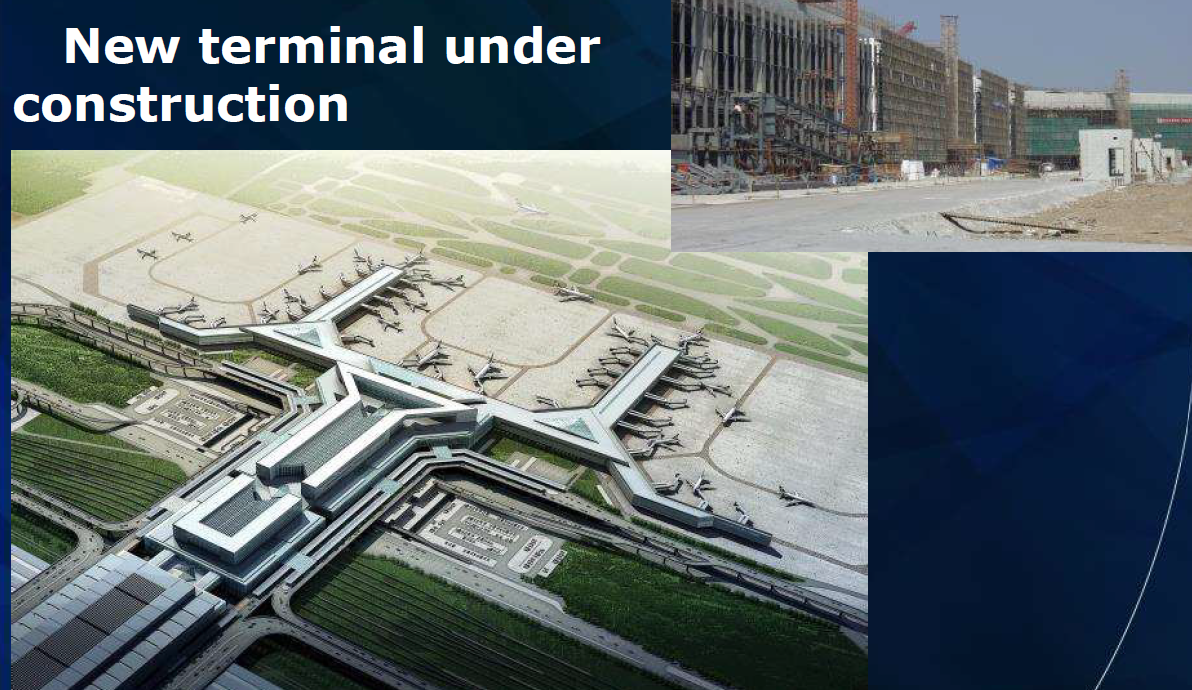
Terminal Design Study

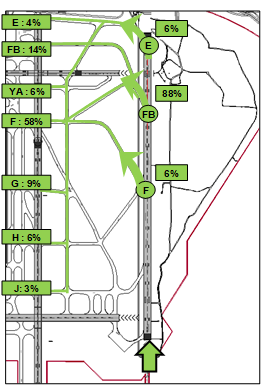
Strategic modeling of structural passenger flow spacing, processing bottleneck optimization, concourse space allocation simulations, gate capacity constraints, and seamless security/baggage checkpoint transit design.

Our Extended Analytical Capabilities Matrix

• Traffic Simulation Modeling: Running dynamic fleet trajectories utilizing specialized TAAM, SIMMOD, and AirTop suites.
• Aircraft Swept Path Analysis: Evaluating exact turning radiuses and wheel track envelopes via AeroTurn and PathPlanner tracks.
• Environmental Acoustics Planning: Structural mapping and modeling of airfield noise distributions using INM frameworks.
• Multi-Aircraft Stand Siting: Apron MARS parking reconfigurations, runway rapid-exit taxiway geometry, and gate optimization studies.
Engineering Blueprint & Layout Criteria

AWF Technical Specifications

Universal Aerospace Solutions translates strict international statutes into exact physical installation blueprints. In strict accordance with ICAO Annex 14 Chapter 6 criteria, we specify the required geometric parameters, color distributions, and visual layout dimensions to secure utility line safety zones.

Tower Painting 1
Tower Painting 2
Tower Painting 3

Aviation Color Banding

High-contrast red and white durable paint banding configurations applied across seven equal structural layers. Individual sections remain bounded within 30-meter width thresholds to lock in daytime pilot line-of-sight visibility rules.

Lighting 1
Lighting 2
Lighting 3

Active Flashing Beacons

Dual-level layout specifications for intermediate and top pylon segments. Systems are engineered without LED nodes inside specific routes to prevent severe tracking reflections across emergency pilot Night Vision Goggles (NVG).

Marker Balls 1
Marker Balls 2
Marker Balls 3

Overhead Catenary Markers

Spherical markers exceeding 600mm diameter mapped across highest circuit shield wires (OPGWs). Elements utilize an alternating, staggered alignment to enforce an optimal 60-meter visible protection interval.

Featured Operational Project Rationale

These rigid physical parameters provide the baseline framework for our completed Aeronautical Study of Aerial Warning Facilities across CLP Power's high-voltage 132kV and 400kV transmission circuits. By applying these exact staggered dimensions and pylon markers, our studies secure full structural compliance while locking down airspace clearances seamlessly.

Empirical Airspace Analytics & Modeling

Surveillance & Traffic Density Analytics

Universal Aerospace Solutions strips guesswork out of asset risk profiling. By deploying advanced ADS-B surveillance ground tracking arrays, our engineering models collect and process actual empirical flight trajectories, evaluating real-world traffic intersections across high-voltage utility corridors.

ADS-B Tracking 1
ADS-B Tracking 2
ADS-B Tracking 3

ADS-B Traffic Surveillance

Continuous capture of low-altitude flight paths, velocity logs, and approach paths over an extensive 12-month evaluation grid. Models track seasonal variations and real-world approach streams to establish hard baseline risk figures.

Consolidated Map 1
Consolidated Map 2
Consolidated Map 3

Consolidated Airspace Hotspots

Layering hundreds of independent flight logs simultaneously onto detailed 3D terrain vectors. This macro data consolidation reveals localized conflict centers where aircraft corridors track near grid lines.

Zoning 1
Zoning 2
Zoning 3

Strategic Risk Assessment

Mapping strict risk bounds based on altitude bands (500–1000ft AGL segments) and stakeholder inputs. We cross-reference commercial fleet movements and emergency flyway counts to sort hazards into CAT 1, 2, or 3 priority tiers.

Empirical Operational Calculations

Our risk assessments explicitly factor in real-world fleet density records: tracking Heliservices commercial operations (~3,600 flights annually) alongside specialized Hong Kong Government Flying Service operations (~5,870 GFS flights annually). This models a highly precise 30% safety threshold vector, providing grid managers with data-justified clearance filing evidence.